The first day’s sessions covered the container crisis and provided outlooks on both the dry bean and lentil markets. Missed the conference? Members can find our main takeaways for Day 1 below and for Day 2 here.
The Container Crunch
Christopher Welsh, an independent consultant, detailed the specifics on the container crisis and gave important insights into what structural factors have led to the current situation. The panel then discussed the ramifications on the industry.
- Three lines basically control the entire shipping industry. The global shipping market has become increasingly concentrated in the last ten years. Whereas 30 years ago there were about 100 shipping lines, that number decreased to 30 in the last ten years and there are now 10 that dominate the market.
- There are few signs of new entrants in the market, even with the rates so high. Barriers to trade are so high because the market is dominated by mega carriers.
- The three main shipping alliances have a 86-98% market share on the four main East-West liner trades
- This is due to the fact that the shipping industry receives exceptional exemption from competition laws eg. vessel sharing agreements.
- Shipping lines can adjust capacity allocation in line with changing demand but combined with high levels of demand, shipping rates are out of control.
Mr. Welsh offered some advice on how to enhance shipper leverage power:
- On the west coast of Canada, services for South America and Europe are being withdrawn and August vessels are rolling into September and October
- The backlog has still not subsided and it looks like new capacity will be available only from October onwards
- Shipping is a hand-to-mouth market currently: carriers are addressing the situation in front of them only and it’s very unpredictable.
- An anticipated ¼ of the normal volume will move through Vancouver
- People are encouraged to look for alternatives, have as many options as possible and spread things out across different ports
- Canadian shippers are advised to make sure they have the booking in hand before shipping. Preparation and communication are key
- Cargo is shifting from the west coast to the east coast of Canada and these ports will struggle to keep up with demand in the peak months ahead
- Capacity and investments have been built up over the past decade in Vancouver and in comparison facilities on the east coast are not equipped to handle large volumes
- Regardless of east or west, transit times are increased due to global congestion at major ports, which are seeing delays of at least 30 days. Cargo is being moved along non-traditional routes, making for longer journey times. Buyers should be buying well in advance
- The European commission and US Department of Justice have broken up some of the monopoly of big carriers and introduced smaller carriers into their markets
Dry Bean Market Outlook
Mr. Chuck Penner of LeftField Commodity Research gave an in-depth analysis of the dry bean market as it stands, in Canada and abroad, followed by a panel discussion.
Production
- Compared to a record seeded area in Canada of just over 450,000 acres in 2020, this year’s acres dropped back to a more normal 370,000- 380,000 acres, according to StatsCan
- The crop insurance acres point to a 10% decline in total area with pintos, blacks and navies down 7%, 5% and 10% respectively - nonetheless sizeable acreage
- Production outlooks in West and East Canada looking very different based on the growing conditions so far this year
- Production for 20/21 is looking at around 325,000 MT, down 33% from last year’s high
Exports
- This last year, there was a strong start to exports, which were well above average in the 1st half but slower through the 2nd half
- Compared to the end of 2019/20, there were almost no supplies of dry beans in Canada or anywhere else
- Exports in the 1st part of the year had to wait for the harvest, which was followed by very high exports as buyers refilled their inventories
- In the last 4 months, things moved back to a more normal picture
- In the CY 20/21, there was a record export program just shy of 400,000 MT with blacks up 66%, pintos up 30% and naves down 1% compared to previous years
Supplies
- With a crop of about 489,000 MT last year with 396,000 MT of exports and some imports, it’s looking like there was sizeable supplies in this last year. If this is the case, going into next year we’ll have comfortable supplies however this is not 100% because of price fluctuation
- Supplies might not be as tight as the production numbers would suggest.
US Outlook
- This year, planting of blacks was down 20%, navies 12% and pintos 19% in acreage from 2020, according to estimates from NASS and FSA in 2021. Even before any crop issues, we’re setting up for a smaller crop in 2021.
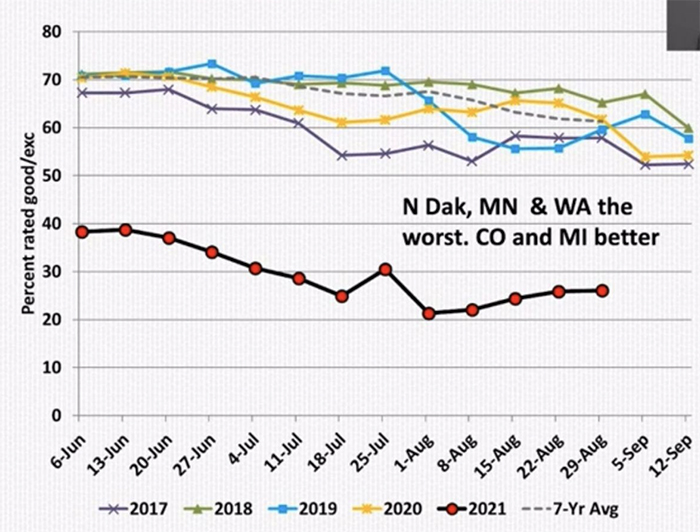
- The USDA crop weights were a little below 17 bags. By acreage, the condition of the crop is far worse than the last few years and definitely below average
- 30% of crops were rated below good/excellent. The Western producing states of North Dakota and Minnesota are the worst, with Michigan and Colorado looking better
- With lower acres and yields, we’ll see a drop of 29% in the US crop compared to 2020 with production estimated at between 1,800 and 1,900 lbs/acre and yield at around 1,700
- Bids for US beans are almost back at the highs of 2011
- Likewise for black beans, which have been lagging since 2016 but are now moving into premium product area
- Blacks are pushing above pintos and navies but the question is whether or not at those levels we will see indications of demand rationing
- Navies are also heading back up to the old highs of 2011/12, momentum is high
Mexico Outlook
- The summer crop area has declined some. Early on, it was dry and the rains improved in July so the crops may not be hit quite as hard
- There will probably be a small decline with production estimated at around 750,000 MT
Argentina Outlook
- Numbers from the Ministry of Agriculture are suggesting they could see a record dry bean production of about 750,000 tonnes
- This will help to supply some of the Latin American market, particularly Brazil
- Export pattern was starting to pick up in July and move higher, which is normal behaviour for now
Takeaways
- There has been a significant drop in both Canadian and US crops, with both lower acres and yields
- There are questions about seed size and whether drought conditions have influenced these
- Carry-over is a concern. If supply levels are at what initial numbers are suggesting, the upward price trend may be curtailed somewhat however market behaviour is contrary to the suggestion of significant carry-over from a lack of growers selling and the inability to fill bids, although this is partly a hedge against the drought concerns
- There is a good probability that the western production areas will contribute with an average to above average crop but the drought-affected areas will skew that average
- Farmer selling is limited, they are waiting to see if they can fill contracts
- Steady mexican crop and larger Argentine one will alleviate the Latin American demand somewhat
- Prices could subside after harvest but production numbers are still uncertain
Lentil Market Outlook
In this session, Marlene Boersch of Mercantile Consulting, gave a comprehensive analysis of the lentil market as it stands, followed by an informative panel discussion.
Main takeaways
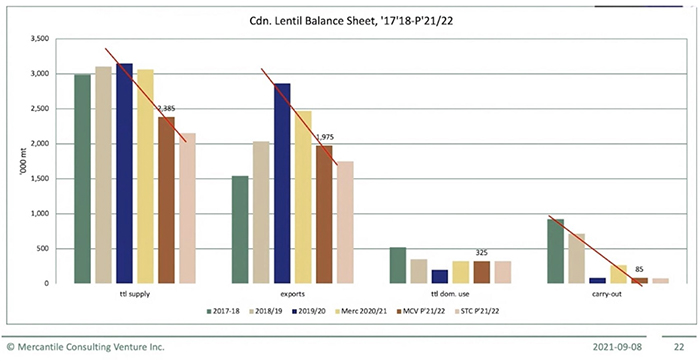
- This year started off with 4.3 million acreage outlook, which at average yields would give 2.6 million tonnes. As it is, we’ll be looking at 2 million tonnes coming from Canada
- Market sentiments: last year, the focus was on demand while this year it is the supply side that needs more scrutiny because of production problems
- Transport costs and availability play a much bigger role than last year. Lead times need to be considered more seriously as they can be potentially double, especially for destinations with more than one port involved
- Seasonalities for shipping might evolve differently because of availability issues and at some point buyers might shut off inquiries
- Price peaks could be reached earlier than previous years as people will focus on the acreage outlook for 2022
Challenges
- Canada normally contributes 45% of the major producers’ lentil production and 50-64% of the export trade. This year production, share will fall to 37%
- The reduction in Canadian production will lead to short supplies for normal import countries, which will mean a reshuffling of supply patterns
- Big questions for Canadian farmers are how to maximise returns from a reduced crop, how does shortfall affect seasonalities and when have we reached near peak prices?
- Big questions for exporters are: how to best source the best volumes/quality, how will the shortfall affect buying patterns and which origins/crops will be substituted and at what level will demand turn off?
- The percentage of normal soil moisture across the prairies was very low
Production
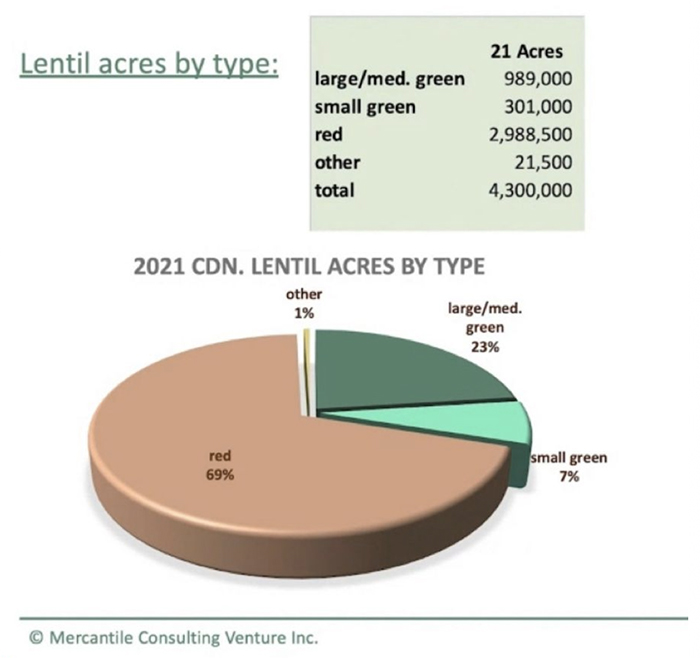
- 3 million total acres of lentils were seeded
- Red lentils have become predominant on the prairies